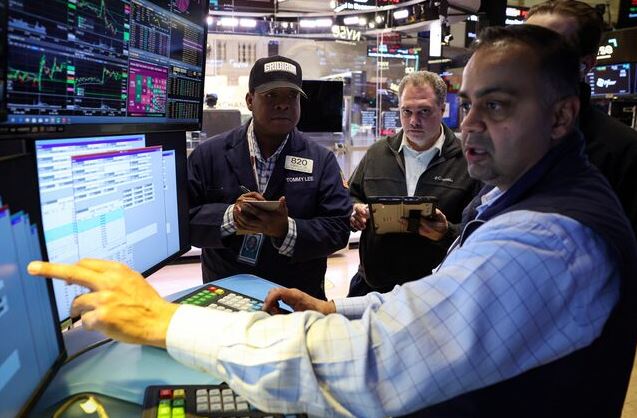
Every morning, before most people have finished their first cup of coffee, traders in London are already responding to signals from Tokyo, Seoul, and Shanghai. The numbers flashing across their screens are not random data points. They are market indexes, and they carry the collective weight of investor sentiment, corporate earnings, monetary policy, and geopolitical risk compressed into a single figure.
Whether you are a retail investor, a corporate treasurer, or simply a citizen trying to understand why prices are rising, global market indexes shape decisions that affect you directly. This guide cuts through the jargon.
What a market index actually is
A stock market index is a statistical measure that tracks the performance of a defined group of securities within a specific market or across multiple markets. Think of it as a weighted average representing the aggregate value of its constituent companies. When the index rises, the combined market value of those companies has increased. When it falls, wealth has been destroyed, at least on paper.
Indexes are not tradeable instruments by themselves. You cannot buy the S&P 500 directly. What you can buy are financial products tied to it, such as index funds, exchange-traded funds, futures contracts, and options. The index is a benchmark; the products that track it are the investable vehicles.
Most major global indexes use one of two weighting methods. Market capitalisation weighting gives larger companies proportionally more influence. A 2% move in Apple will shift the S&P 500 more than a 2% move in a mid-cap constituent. Price weighting, used by the Dow Jones Industrial Average and Japan's Nikkei 225, assigns influence based on a company's share price rather than its total market value.
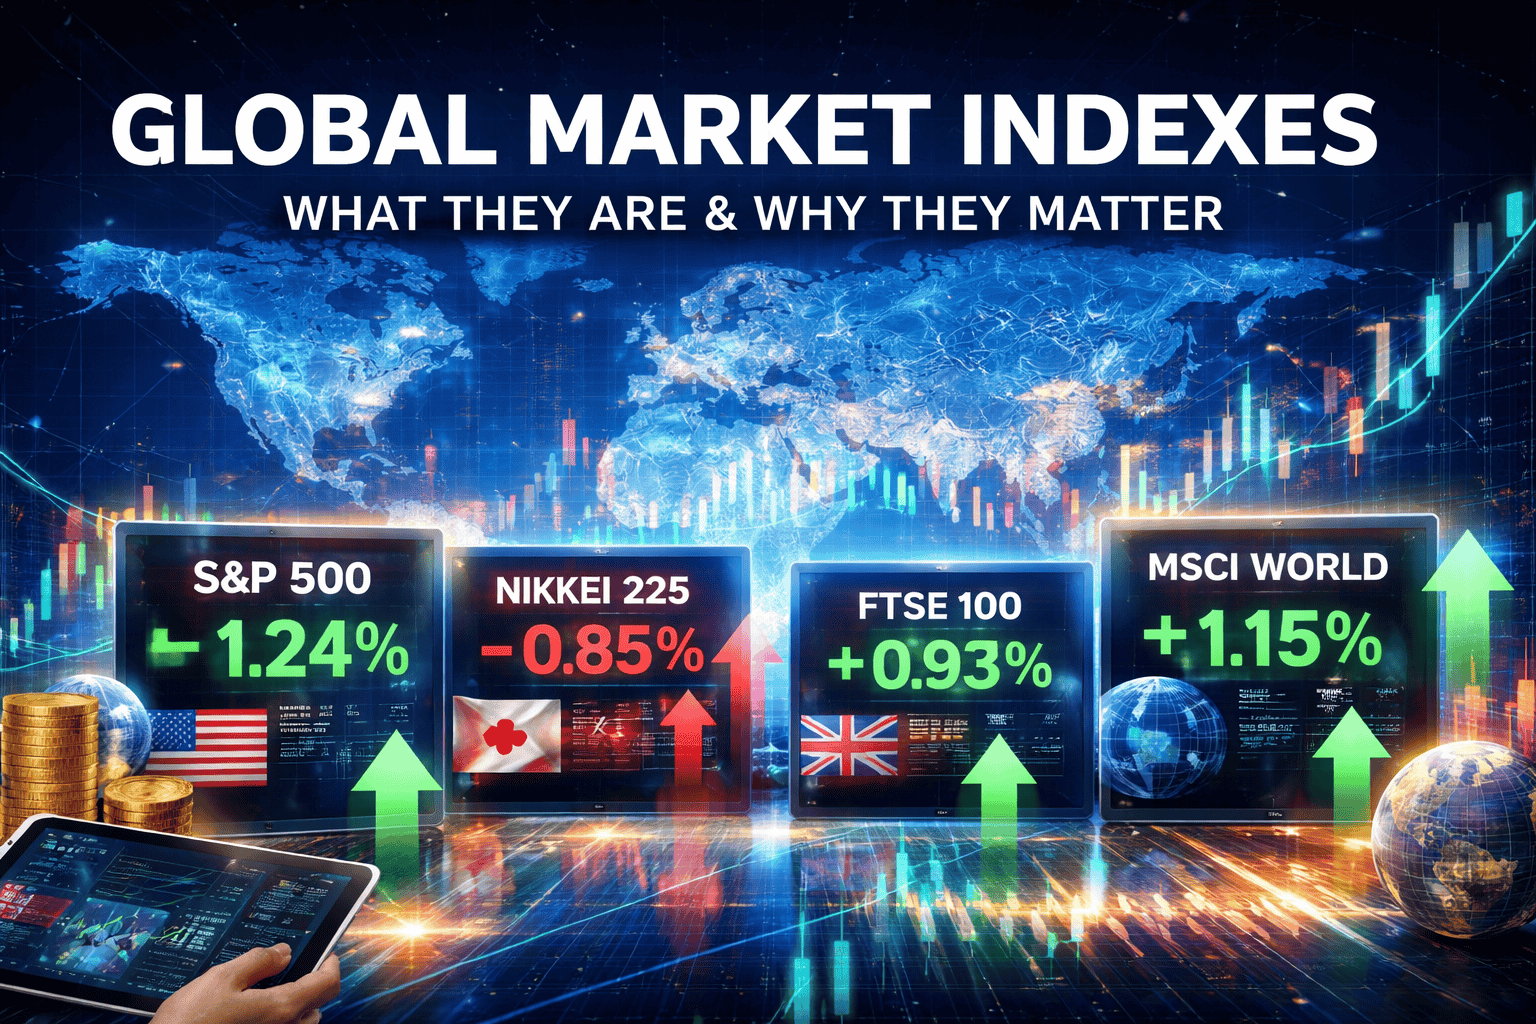
The major global indexes you need to know
United States
The S&P 500 remains the single most watched equity benchmark on the planet. Its 500 constituents represent roughly 80% of the total US equity market capitalisation. When US technology stocks fell sharply following tariff announcements in 2025, the index dropped more than 15% from its year-to-date level before recovering, rattling markets from Frankfurt to Mumbai.
Global
The MSCI All Country World Index covers more than 2,500 large and mid-cap equities across 47 developed and emerging market countries. In 2025, it climbed over 21% to reach a record high, though gains were strikingly uneven across regions, with Latin American markets dramatically outperforming much of the developed world.
Europe
Germany's DAX, Italy's FTSE MIB, France's CAC 40, and the UK's FTSE 100 all posted solid weekly gains in early April 2026, buoyed by banking sector strength. The eurozone is navigating complexity: inflation climbed to 2.5% in March 2026 driven by energy costs, while Germany's leading economic institutes revised down the country's 2026 growth forecast from 1.3% to 0.6%.
Asia
Japan's Nikkei 225 fell 1.7% in the most recent trading week as geopolitical tensions resurfaced. China's official Manufacturing PMI rose to 50.4 in March 2026, its fastest expansion rate in a year. South Korea recorded one of its strongest annual performances in years during 2025, driven by Samsung Electronics and SK Hynix.
How indexes are built and maintained
Index providers such as MSCI, S&P Dow Jones Indices, FTSE Russell, and Nikkei Inc. each maintain detailed methodologies covering which companies qualify for inclusion, how weights are calculated, and how often the index is rebalanced.
Inclusion criteria typically involve minimum market capitalisation thresholds, liquidity requirements, and domicile rules. When a company is added to a major index, it triggers forced buying from passive funds that track that index. This mechanical demand is why index rebalancing events can move individual stock prices significantly, even when nothing fundamental has changed about the business.
Why market indexes matter beyond investing
For individual investors, indexes serve as performance benchmarks. A fund manager who returns 8% in a year where the S&P 500 returned 12% has underperformed, regardless of how impressive that 8% sounds in isolation. This benchmarking function has driven the explosive growth of passive investing, where trillions of dollars now simply track index returns rather than trying to beat them.
Beyond portfolios, indexes function as economic indicators. Sustained declines often precede recessions, as falling stock prices reflect reduced corporate earnings expectations and weakening consumer confidence. Central banks and finance ministries monitor equity market conditions closely when calibrating policy responses.
Sector-level index data reveals where economic momentum is concentrated. Throughout 2025 and into 2026, communications and information technology dominated global index performance, driven by enthusiasm around artificial intelligence. Communications has remained the leading sector globally for multiple consecutive years within the MSCI ACWI universe.
What the current data is telling us
The picture entering the second quarter of 2026 is one of notable divergence. European equities have shown resilience despite softening growth forecasts. Asian markets present a more complicated picture, with Japan falling on geopolitical news while China's manufacturing data improved. The broader message is that investors are being selective in a way they were not during the broad rally of 2025.
Tariff uncertainty from US trade policy, elevated valuations in parts of the technology sector, and uneven central bank trajectories are all contributing to a more fragmented environment. Reading market indexes carefully, rather than simply checking whether the number is up or down, has never been more important.