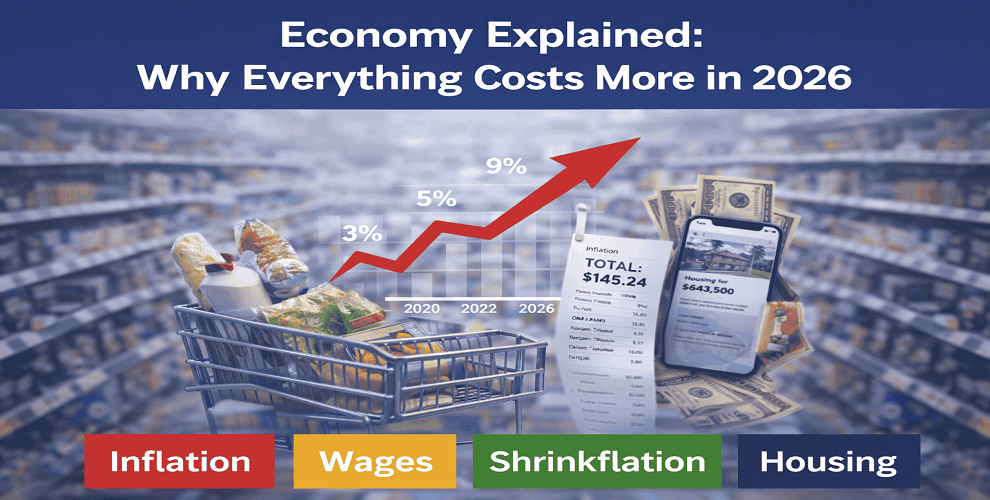
Walk into any grocery store, open a housing app, or check your credit card statement and the feeling hits quickly. Prices are high. Not just a little high. High in a way that feels permanent, structural, and deeply unfair when you compare what you pay today to what you paid three years ago. Yet official reports insist inflation is "cooling." So what exactly is going on?
The honest answer is that both things are true at once. The rate at which prices are rising has slowed significantly since the peak of 9.1% in June 2022. But slowing down is not the same as reversing. The prices you are paying today are built on top of years of compounding increases, and many of them are not coming back down. Understanding this distinction is the first step to making sense of your own financial reality.
Who Is Measuring Inflation, and What Are They Actually Counting?
The Consumer Price Index, published monthly by the US Bureau of Labor Statistics, is the number most people see in news headlines. It tracks a fixed basket of goods and services purchased by urban households. Housing, food, transport, healthcare, and energy each carry a different weight in the basket, and the percentage change in what that basket costs from one year to the next is reported as the inflation rate.
As of February 2026, the headline inflation rate was 2.4% and core inflation was 2.5%. These numbers sound manageable, almost boring, compared to the panic of 2022. But they tell you nothing about the cumulative damage already done to purchasing power since 2020.
A simpler way to think about it: if a grocery basket that cost $100 last year now costs $105, the economy has experienced 5% inflation. The CPI tells you the rate of change this year. It does not tell you that prices already climbed steeply to reach this starting point.
The CPI measures the rate of change in prices, not whether prices have actually dropped. If inflation falls from 9% to 2%, prices are still rising. They are just rising more slowly.
Who Is Actually Being Hit Hardest by Persistent High Prices?
Lower-income households and fixed-income earners
Inflation does not affect everyone equally. A household spending 40% of its income on rent and groceries feels price increases far more acutely than a household where those categories make up only 15% of spending. National averages mask a critical reality: inflation does not affect all households equally.
During peak inflation in June 2022, prices rose at a staggering 9.1% annual rate while nominal average wages grew by only 4.8%, resulting in a significant 4.3 percentage point decline in real wages. That gap meant workers were, in practical terms, taking a significant pay cut without anyone changing the number on their paycheck.
The long-term picture is sobering. Since March 2006, the nominal average weekly wage in the US rose by 82.3%, but after adjusting for inflation, the real increase in purchasing power was only 12.7%.
First-time homebuyers and renters
Housing is where the collision between interest rates and persistent prices is felt most viscerally. Mortgage rates, even after moderating, are still well above their pre-2022 levels, hovering near the 6% mark at the end of January 2026, which prices out many first-time buyers. A 1% rate increase can reduce a buyer's budget by up to 10%.
Renters face a separate but related squeeze. Rents in many cities have plateaued at all-time highs after surging for years. Landlords rarely drop prices significantly once they have raised them. For anyone who moved or renewed a lease in 2022 or 2023, the new baseline is simply more expensive, with no meaningful relief in sight.
Why Does Inflation Feel Worse Than the Numbers Suggest?
The problem of shrinkflation
One reason your spending feels stretched even when the official inflation rate looks modest is a phenomenon called shrinkflation. Companies shrink product sizes while keeping prices the same. A bag of chips that once held 12 ounces now holds 10. A box of cereal is just a little lighter than it used to be. The price tag has not changed, but the value has. The CPI does not always capture these reductions cleanly or immediately, which means real-world purchasing power erodes in ways that official statistics undercount.
The cumulative compounding effect
Inflation compounds. When prices rise 4% one year and then 3% the next, the base from which the second increase is calculated is already elevated. Over a five-year period, even moderate annual inflation produces a substantial gap between what money used to buy and what it buys today. Someone would have needed about $355 in 2023 to purchase the same goods and services that $100 bought in 1980. For most consumers, this gap is experienced not as an abstract economic concept but as a visceral monthly shortfall between income and expenses.
Wage growth that lags the right categories
Real average hourly earnings sat at just over 1% growth from 2024 to 2025. Aggregate figures mask deep sectoral divergence. Workers in healthcare, logistics, and technology saw stronger wage gains. Workers in retail, hospitality, and care work saw far more modest increases, precisely in the sectors where workers most affected by high essential goods prices are employed. The people who need wage growth most are often the ones receiving the least of it.
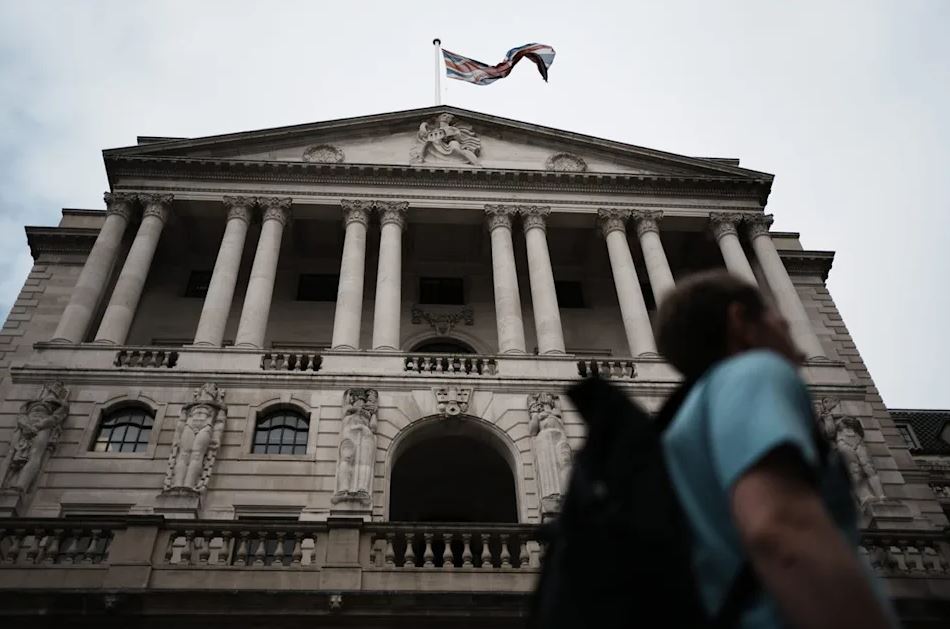
Who Controls Inflation, and What Tools Do They Have?
The Federal Reserve is the primary institutional actor responsible for managing inflation in the United States. Its main instrument is the federal funds rate. To control inflation, the Federal Reserve raised interest rates rapidly in 2022 and 2023, taking borrowing costs to the highest levels in decades. This made mortgages, car loans, and credit cards more expensive, slowing down big purchases.
In August 2025, the Fed completed a review of its monetary policy framework and announced key changes. The revised framework returned to a more traditional, flexible inflation-targeting approach and re-emphasizes a balanced approach when maximum employment and price stability goals conflict.
What the Fed cannot control directly is supply. When global supply chains fracture, when energy prices spike due to geopolitical shocks, or when specific sectors face structural shortfalls such as the housing market's chronic undersupply, monetary policy is a blunt instrument. Raising rates slows demand but cannot build more homes or rewire trade routes.
What Does the Outlook Look Like Heading Into 2026 and Beyond?
The International Monetary Fund expects CPI inflation to average about 3.0% in 2025, slightly higher than in 2024, largely due to new tariffs, and forecasts that inflation could fall closer to 2.5% in 2026 as the economy continues to stabilize.
The Personal Consumption Expenditures price index, known as PCE, is the Federal Reserve's preferred measure of inflation. Core PCE rose 3.1% over the past year. Analysts continue to place a meaningful probability on a recession scenario that could accelerate the disinflation process, though the labor market has remained resilient.
For individual households, the practical implication is that prices are unlikely to return to 2019 or 2020 levels. The more relevant question is whether wage growth, investment returns, and institutional support can keep pace with a permanently higher price baseline. For those on fixed incomes, in low-wage employment, or carrying significant variable-rate debt, the gap between purchasing power and cost of living is likely to remain uncomfortably wide.